The NHL season is here, and we were curious when goals occur throughout the game. In many sports, we expect goal scoring to increase toward the end of the game as players begin to tire or take more risks to win the game. For hockey, one other thing to consider is power play goals. Therefore, it is also useful to look into these ideal goal scoring opportunities, when they occur, and whether their occurrence coincides with increased goal scoring.
Breakdown of NHL Goal Scoring by Period
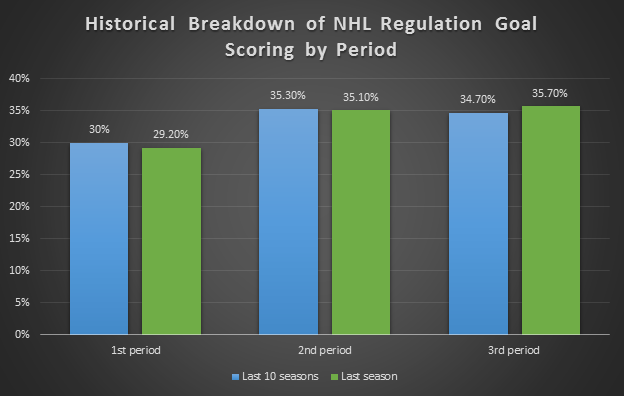
A historical breakdown of NHL goal scoring by period
Around 30% of goals in regulation are scored in the first period. Goal scoring then increases slightly, so that around 35% are scored in each of the last two periods. The increased goal scoring beginning in the second period is likely attributed to the long-change effect. The long-change effect occurs during the second period because the teams switch ends requiring more effort to make line changes. This creates a situation where tired, less effective players are on the ice but unable to quickly switch out, creating more opportunities to score. During the third period, the increase in goal scoring may also be attributed to more risk taking. Playing with an open net for example, creates a situation similar to a power play but also leaves the goal unattended.
Breakdown of NHL Power Plays by Period
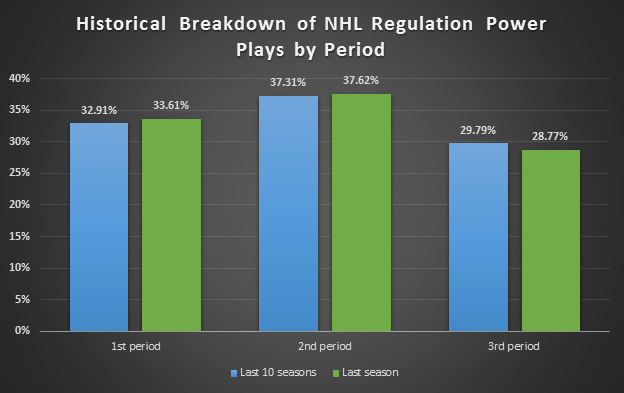
A historical breakdown of when power plays occur by period
I was surprised to find that the power play graphic above did not mimic the goal scoring one. As an important part of goal scoring, I would have expected the breakdown to be similar. However, we are looking at opportunities and not actual power play goals scored. We see that during the first and second period, the percentage of power plays is a couple percentage points higher than goals scored, whereas in the final period the power play percentage is lower. One possibility is that earlier in the game, the players are fresh so they can better defend power plays. In the final period, even though there are less power plays, the conversion rates are likely higher due to tired players and players taking more risks to score.
Relationship of Period Goal Scoring and Wins
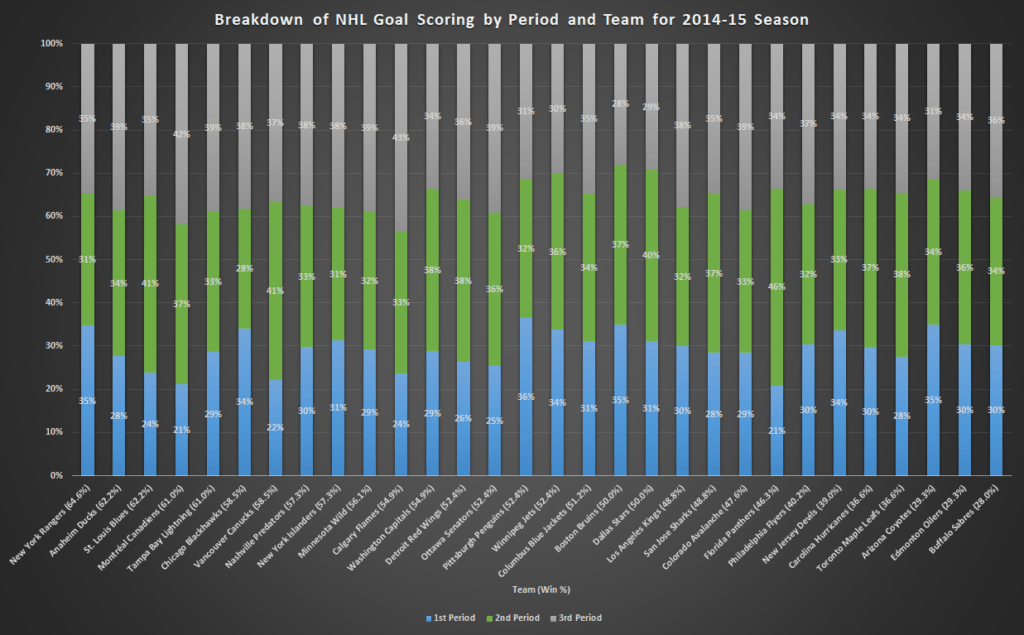
For 2014-15 season, a breakdown of period goal scoring by team (winning percentage in parentheses)
We were also interested in whether a team’s scoring breakdown is related to its overall winning percentage. In the above plot, we have given each team’s goal scoring breakdown for the 2014-15 season. The teams are ordered by descending winning percentage. One thing to notice is that the teams with the highest winning percentage also have a higher 3rd period goal scoring percentage. This makes sense as the teams that can get the job done when the game is on the line are likely winning more often. This is true also for overtime games. Where does your favorite team fall in the above graph?
Conclusion
This analysis can be helpful for taking the over/under total goals and knowing what the expectations might be for the period. If you’re interested in reading more about goal scoring, I found a more in depth analysis here: More on goal scoring.