In sports betting, a popular type of wager is the “Time of First Goal” bet, which involves predicting the time at which the first goal will be scored in a specific sporting event, typically in soccer or ice hockey. This type of bet adds an extra layer of excitement and anticipation to the game, as it allows bettors to not only predict the outcome but also the precise moment when a team will find the back of the net.
When placing a First Goal bet, sportsbooks typically offer a range of time intervals, such as “0-15 minutes,” “16-30 minutes,” and so on, with varying odds assigned to each interval. The odds are usually higher for the earlier time intervals, reflecting the lower likelihood of a goal being scored in the opening minutes of the game, and gradually decrease as the time intervals progress.
I’ve found a particular interest in this type of bet as PrizePicks has this offering and I wonder if it is a beatable prop.
Goals Allowed in 30 Minutes – PrizePicks
Below, I dive into some data and give my analysis on whether this a prop that should be targeted on PrizePicks.
A Little About the Data And Methodology
The methodology is pretty simple. I want to use full game over/under data to help project when the first goal is scored. As the over/under of the game goes up, the projected time of the first goal should go down. Could this help us find profitable angles? To beat PrizePicks, one has to beat props at a rate of 54.25% to break even. Thus, there are main two things that I am interested in calculating. First, at what over/under value will 0 goals allowed in thirty minutes hit 55% of the time? And second, at what over/under value will at least one goal allowed in thirty minutes hit 55% of the time?
The dataset was a little bit harder to put together. I used a dataset with 811 observations from Major League Soccer with games going back through the beginning of the 2022 season. While it would be preferred to use a slightly bigger dataset, there is was a decent about of manual data input that went into this project so I stopped it there.
The data was grouped into ten deciles by expected goals. I won’t get into the exact values here, because it’s proprietary information, but the gist is that I converted over/unders in expected goals. For instance, if the over/under of a game is 2.5 with -110 juice on both sides, then the expected goals are 2.5. These values change as the juice and odds change.
What Are the Results?
As mentioned before, the sample size of 811 is a little bit small for my liking, but the results seem to give us what we need to draw a decent conclusion on our previous questions.
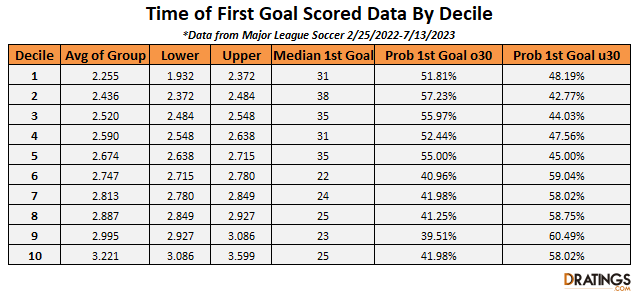
Each group has 81 observations, so we expect to see a little bit of randomness across the data. Still, there is a clear negative correlation (-.7072) between full game expected goals and the median time of the first goal. This was expected and is good! Basically, this means that we can confidently draw a trend line to estimate the values at which the time of first goal bet can be profitable.

After drawing a trend line, it is estimated that at 2.62 goals, there is exactly a 50-50 chance of a goal being scored over or under 30 minutes.
How Should This Be Played?
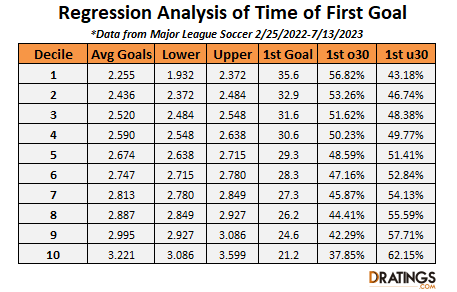 The regression analysis of this data is to the left. There is a pretty easy way to play this. If expected goals are 2.40 or less, then the play is no goal in the first 30 minutes. The American odds conversion to expected goals of 2.4 would be u2.5 -111.
Further, if expected goals are 2.8 or more, then the play is at least one goal in the first 30 minutes. The American odds conversion to expected goals of 2.8 would be o2.5 -131 (or u3 +126). Remember that these numbers are without the vigorish. On the lower end, I think that the 2.4 expected goals number is pretty conservative. With more data, that first decile bucket would surely show that 1st goal occurs much later than we found.
Other Thoughts
A lot of analysts like to float the idea of using the Poisson distribution when looking at projected goals in soccer. While generally, this works when looking at full game statistics, it greatly fails in predicting the micro statistics within a game. This occurs for a variety of reasons, however the biggest factor in soccer is injury time. If a player goes down with an injury or if the game gets stopped for some other reason, then the clock doesn’t stop. This time gets added on as “stoppage time”, and thus, you end up with a much higher proportion of goals in the 45th minute and 90th minute.
Another major factor that plays into the Poisson distribution failing is that there is typically a push by the losing team to score a goal at the end of the game. This opens up play and increases the probability that both teams score a goal in the later minutes of a game. This breaks the assumption of the Poisson distribution that there is even probability across a given period of time making this a subpar way to analyze this problem.