Understanding half point values in sports are one of the many keys that a bettor needs to get an advantage. Often times, a bettor will see one one price listed at a sportsbook (i.e over 8.5, -110) and completely different price at another (i.e. over 9, +110). Which price is better for the bettor?!? Our MLB prediction pages do this calculation automatically so the best over/under will show up in our “Best Line” column. While this helps, it’s still essential to know how much these point values are worth. Knowing half point values has become even more crucial now that sportsbooks are offering alternate lines more prominently. There are often diamonds to find in the rough.
Half Point Table for MLB Totals
Here is our Major League Baseball Half Point Table for reference…
| Total | Push Prob | 0.5 Point Down | 0.5 Point Up | 1 Point Down | 1 Point Up |
|---|---|---|---|---|---|
| 5.5 | 0% | 34.05 | 22.55 | 68.1 | 45.1 |
| 6 | 9.2% | 20.26 | 20.26 | 48.24 | 45.81 |
| 6.5 | 0% | 22.55 | 30.21 | 45.1 | 60.42 |
| 7 | 11.6% | 26.24 | 26.24 | 47.06 | 46.38 |
| 7.5 | 0% | 30.21 | 21.65 | 60.42 | 43.31 |
| 8 | 8.9% | 19.54 | 19.54 | 45.01 | 44.57 |
| 8.5 | 0% | 21.65 | 29.53 | 43.31 | 59.07 |
| 9 | 11.4% | 25.73 | 25.73 | 45.82 | 40.63 |
| 9.5 | 0% | 29.53 | 15.21 | 59.07 | 30.41 |
| 10 | 6.6% | 14.13 | 14.13 | 38.54 | 33.83 |
| 10.5 | 0% | 15.21 | 22.55 | 30.41 | 45.1 |
| 11 | 9.2% | 20.26 | 20.26 | 34.8 | 34.14 |
| 11.5 | 0% | 22.55 | 14.42 | 45.1 | 28.83 |
| 12 | 6.3% | 13.45 | 13.45 | 33.08 | 29.46 |
| 12.5 | 0% | 14.42 | 17.65 | 28.83 | 35.29 |
| 13 | 7.5% | 16.22 | 16.22 | 29.84 | 27.68 |
| 13.5 | 0% | 17.65 | 11.86 | 35.29 | 23.71 |
| 14 | 5.3% | 11.19 | 11.19 | 27.03 | 25.34 |
| 14.5 | 0% | 11.86 | 15.47 | 23.71 | 30.95 |
At first glance, this table can look a little bit confusing. In an effort to simplify, I’ll give an example on how to use it.
Let’s say that the under on a game is 7.5, with the odds of +100 at Sportsbook BetMGM. Also, at BetMGM, we see that there is an alternate line for the under at 7 (+125). Which is the better bet? To find out, we simply go to our table and find out what the cost is to go from 7.5 to 7. Our table tells us that it is 30.21 cents. Now, moving from 7.5 to 7 at odds of +100 to +125 only gives us 25 cents. Thus, the bet is better at 7.5. Basically, the 30.21 cents is how much the price would need to move to make the bet worth it. Thus, if we got under 7 at +131 or better, then we would make that bet.

Photo by Owen Lystrup on Unsplash
Methodology
Where do these half point totals come from? If you scoured the internet looking for these, then you may see that different people use different numbers. In fact, it’s unlikely that any two people will have the same numbers. Why is this? To calculate these half point totals, one needs to know the push probability at every whole number (it should be obvious that half point numbers can’t push). Nothing about the total run distribution is normal.
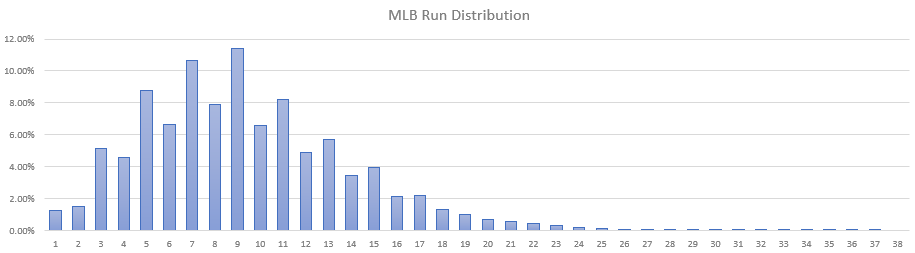
Above is what the smoothed distribution of totals are for Major League Baseball. This is before we take the effect of over/under’s into account. Odd numbers are way more likely to occur. Why? Because a baseball game can’t end in a tie. Thus, when a score is tied 4-4 after 9 innings, the teams keep playing to determine a winner. Therefore, hitting an odd number is much more likely than hitting an even number.
But it is also not enough to just look at the distribution of all Major League Baseball scores, assign push probabilities and then call it a day. This is because a distribution shifts based on what the likely over/under is. What does this mean? When an over/under is say 7, then there is a higher probability that the game’s total lands on 7 versus if the game’s over/under is 11. All of this needs to be accounted for in the calculations. This provides challenges for all over/unders that have limited data on them (i.e. over/unders < 7 or over/unders > 12).
We are also constantly reevaluating this data as there are a variety of things that can change this distribution. If one is doing this on there own, then it’s recommended they check the data at least twice a year to make sure they haven’t missed out on any changes.