Since the end of 2019, we have been rolling out new features that offer an analytical look into a variety of different betting markets. All of the systems that we are going to summarize here are complex. Rather than getting deep into the weeds, this is meant to give a brief overview of what each piece encapsulates.
Matchup Page – Bet Analysis
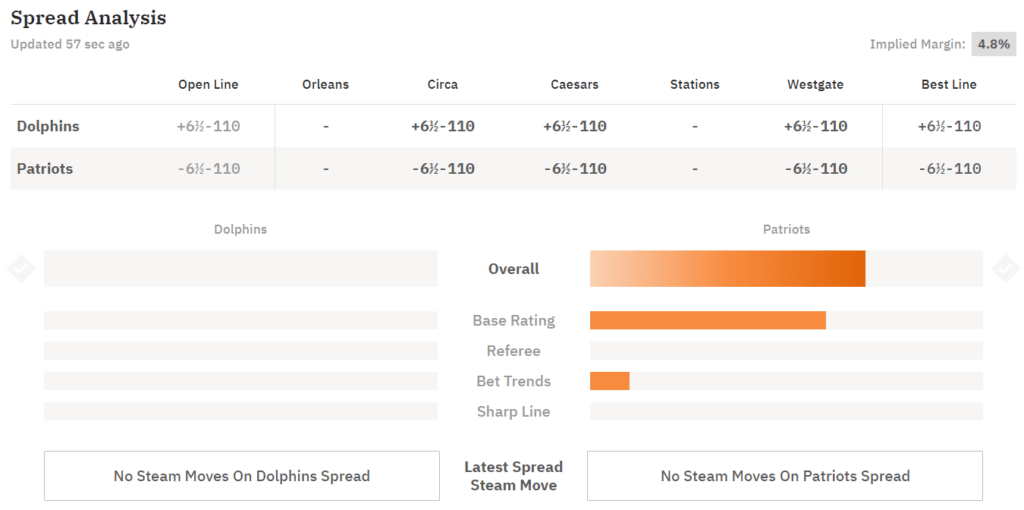
Where Does Base Rating Come From?
Even though this is the most complex system of them all, it may also be the easiest to answer. Quite simply, the Base Rating is what our number cruncher thinks the outcome of the game will be relative to what the oddsmakers think. Weather and referees are not included here as they are broken out later, however injuries are included. A lot more about what factors drive this feature can be read about in our Predictions Disclamer.
Example: If the best line on both sides of a money line are -110, then the sportsbooks project a perfectly even matchup (i.e. 50/50 chance to win). If our Base Projection thinks the away team has a 48% chance to win and the home team a 52% chance to win, then one will see the bar shaded slightly in favor of the home team.
Weather and It’s Effects
There are a myriad of ways that weather can shape the outcome of a game. One extreme example that comes to mind was when Hurricane Matthew took it’s toll on the mid-Atlantic. Notre Dame traveled to Raleigh and played N.C. State in one of the sloppiest games that one would ever watch on television. Obviously, weather only plays a factor in sports that are played outdoors (so you won’t see this in CBB, NBA or NHL). That said, weather can absolutely play a big factor in college football, the NFL, and particularly the over/under in baseball. We take a bunch of factors into account like temperature, wind, rain forecast, etc. and encapsulate it into the bar chart. Further, we’ve even done specs and profiled every stadium to understand the effect of wind moving in different directions.
Example: The wind at Wrigley Field is blowing out to centerfield at 17 mph. There will be a significant shade on the bar toward the over in this scenario.
A Referee Or Umpires Effect
It shouldn’t shock anyone the referees have an enormous impact on the game. There are a variety of factors that make this the case. An umpire with a tighter strike zone means that more batters will be walked and more runs are scored. A referee crew that calls pass interference more often will have (on average) higher scores. These are only a few examples of many. We have a database of umpires and referees and we chart how their calling the game will affect the outcome.
Example: Jerome Boger is announced as the referee of an NFL game. When his crew officiates, the home team and over hit or win much more often than average. The shaded bars will reflect that.
What Are Bet Trends?
The Bet Trends feature is a completely separate analysis of a given contest. What we do with Bet Trends is look specifically at the markets of the betting data to try and figure out who will win. This is unique in that we don’t do any analysis on the teams at all for this feature. We take bet percentages, sharp money, line moves and a few other factors and package it into one proprietary formula called Bet Trends.
Example: Heavy bet numbers come in on one side of a contest, but the line doesn’t move or moves more favorably toward the team with the heavy betting (also called a reverse line move). This means, typically, that the sportsbooks think the public is wrong and our shaded bars will reflect this information.
The Sharp Line Feature
This is our proprietary formula that predicts which direction we think the line will move. A variety of factors could cause this, but usually it is that one or more sportsbooks are slow to move their line on a piece of information. We take in a variety of factors to account for what the current line should be.
Example: At MGM the line on an away team is +100 and at Caesar’s the line on the home team is +110. This is an imbalance in the markets and an arbitrage opportunity. The Sharp Line bar will be shaded in the direction of the team that appears to have lagging lines.
Putting This All Together – the Overall Bar
Combining all of these features together gives us the Overall Bar. This bar is simply a summation of all the factors listed below it in the analysis. When the bar fills up enough, the check mark next to it glows to show that there is value to place a bet at the best line available. It’s best to get your bet in quickly, because good prices can come and go quickly as well!